Posts

Showing posts from February, 2022

Richmond Real Estate Market

Image
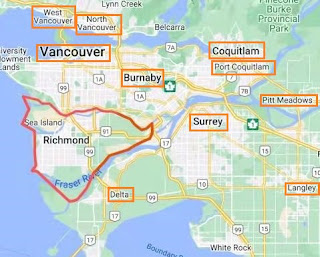
Richmond is an island city. It is made up of a number islands in the Fraser River delta. It is just one meter above sea level. It was prone to flooding, especially during high tide. Therefore, major islands are now surrounded by a system of dykes, which serve to protect the town. Also, since it occupies land in a river delta, the city has plenty of rich soil for agriculture. Richmond is a culturally unique community. As of 2021, the city has an estimated population of 209,937 people with 60 percent being immigrants, the highest proportion of immigrants in Canada. Majority of immigrants are Chinese. Richmond has been experiencing growth and change, transforming from a rural, local community to an international city with a balance of urban, suburban family and rural areas. The city is 20 minutes from downtown Vancouver and 25 minutes from US border. It’s the location of Vancouver’s international airport.  The SkyTrain, Canada Line, speeds up transit system and connects Richmond to other

Detached Property Market in Greater Vancouver

Image
  Greater Vancouver, also known as Metro Vancouver, is a metropolitan area with a population 2,642,825 based on the 2021 census. Click here for the map and detail population in each sub-area. The city of Vancouver is its major urban center. The table below, from the Jan. statistic report, is a list of benchmark price and percentage changes in each sub-area of Greater Vancouver. The list is in decreasing price order. The table indicates that the highest benchmark price is in Vancouver West at  $3,445,400, and the Sunshine Coast is the lowest benchmark price at $900,000.  However, Vancouver West has the lowest percentage change in the 1,5 and 10 years range. The numbers with the yellow mark are the areas with the highest price changes.   If you would like to have information regarding townhouse or apartment market in Greater Vancouver, please click here or contact me at awang@macrealty.com

Vancouver Real Estate Market

Image
  Vancouver is a major city in Western Canada with population of 662,248, based on the 2021 census. It has the highest population density in Canada. It is one of the most ethnically and linguistically diverse cities in Canada. According to the 2016 census, only 48.2% of its residents are European. The total visible minority population is 51.6%, of which Chinese is the largest one at 27%.  Vancouver is one of the most livable cities in Canada and in the world. Also, it is one of the most expensive cities in Canada and in the world. The table below are the benchmark price change in three categories: apartments, townhouses and detached properties. All three categories have had a significant increase in past 10 years: apartments 95%, townhouses 98% and detached properties 94%.  Making them more visible, let’s take a look trend of the market. See the figures below: Benchmark Price in Detached Properties Benchmark Price in Townhouses Benchmark Price in Apartments From these graphics, we can

Residential Tenancy

Image
  Do you invest in real estate market? Do you own a property which you would like to rent it out? Here is some key points you need to know and follow. Otherwise, you may get yourself in trouble. Lease agreement Residential Tenancy Regulations from the Province of BC requires that a tenancy agreement must be in writing, signed and dated by both the property owner and tenant. Also, it requires some items be included. Making things easier, I suggest you download a standard form from Residential Tenancy website   It includes every necessary item. Type of tenancy Generally, a landlord and tenant have a fixed term to begin. When the term expires, if the landlord and the tenant don’t enter into a new agreement, and the tenant continues to stay, the original agreement is automatically renewed on a month to month tenancy. T enancy termination If   the tenant wants to end tenancy, at least one month notice has to be given. It's more complicated for the landlord to end tenancy. More deta

Condominium Market in Vancouver West, BC

Image
  We discussed condominium market in Vancouver East . Now let’s look at the situation in Vancouver West. Generally, all markets in west side of Vancouver are higher than east side.   The figure below is condominium benchmark price trend in Vancouver, Vancouver West and Vancouver East since 2005. The price in Vancouver West is much higher. The benchmark price and percentage change in each sub-area in Jan.2022 are listed below. The yellow marks are the highest percentage change, while blue ones are the lowest change. You will notice market in Coal Harbour has been low performance in past 5 years. South Granville has increased strongly in past 10 years. Downtown Vancouver got the highest increase in Jan.2022. However, Kitsilano has the biggest percentage decrease in Jan.2022.  If you would like to take a look sub-area map, click here .  For more market in Vancouver, please click here or contact me at awang@macrealty.com

Condominium Market in Vancouver East, BC

Image
  The figure below represents condominium market  by MLS HPI Price in Vancouver, Vancouver West  and Vancouver East. Vancouver East is lower than  Vancouver West. Now we break down Vancouver  East to sub-areas and take a look how each sub- area does in the market. The table below lists MLS  HPI prices in each sub-area. The listing is in  decreasing benchmark price order. The table above shows the different areas, with the benchmark price, and the percentage change in value over 1 month, and 1, 5, and 10 years. You will notice that the percentage price change for one month is not consistent. Some areas show an increase (Victoria at 1.3%), while others show a decrease (Knight at -2.37%). However, for the 1, 5, and 10 year time frame, the benchmark prices have all gone up, some quite a bit. As an example, over 1 year, South Vancouver benchmark price increased by 22.45%. Over 5 years, Victoria benchmark price increased 51.69%. Over 10 years, Hastings benchmark price went up 154%. If you w

Canadian Major Centres Rental Market in 2021

Image
Canada Mortgage and Hosing Corporation has just released a rental market report for major centres across Canada in 2021. The map below shows where major areas are located. The table below has detailed information on vacancy rate and average rents in these centres in 2021. Rental Condo Apts represents condominium apartment market, and Apts in the RMS is about purpose built rental market. Canada overview rental market vacancy rate: 3.1% in purpose built rental market and 1.8% in condominium apartment market. The average two-bedroom rent: $1,167 in purpose built rental market and $1,771 in condominium apartment market. Also, Vancouver is the most expensive rental market in both categories across Canada. The average two bedroom rent reaches $2,498 in rental condominium apartments and $1,824 in purpose built apartments. If you would like to have more information regarding rental market, please click here or contact me at awang@macrealty.com

Duplexes in Burnaby, BC

Image
  Traditional Duplex A duplex house is two living units attached to each other. Two units are attached side by side in most situation. The shared wall is a common property. The modern style duplex makes the shared wall much smaller than it used to be which is an advantage for owners. It gives owners more flexibility regarding renovations and makes the unit more private.  Modern Duplex The real estate market in Great Vancouver reached an all-time high in 2021. Detached houses become very expensive. A ½ duplex can be a good alternative choice. It’s more affordable. You may be able to get a ½ duplex under $1 million. If you can afford over $1.7 million, you have more choices to get a very nice size and newer ½ duplex, especially in Sperling-Duthie or Upper Deer Lake areas.   The tables below are  the lists of sold duplexes with price under 1 million and over 1.7 million in 2021.  Duplexes Sold under 1M in Burnaby in 2021 Duplexes Sold over 1.7M in Burnaby in 2021 What is your opinion? Wou

Burnaby Sub-areas – Vancouver Heights, Capitol Hill and Willingdon Heights

Image
When you look at the video above, you would agree that all the facilities people would like to have are there. Anyone could find something he/she needs. It’s Confederation Park which is in between Vancouver Heights and Capitol Hill areas, one block from Hastings Street where a lot of grocery stores, restaurants and commercial services are located. It’s within walking distance for people who live on the east side of Vancouver heights, the west side of Capitol Hill, or north-east of Willingdon Heights. Also, it’s only about a10 minute drive to downtown Vancouver from these areas. Besides, more living options are provided, including; single detached houses, duplexes, townhouses and newer condominiums or apartments. Do you agree it’s a good choice to live near by Confederation Park? Let’s take a look the real estate market in these areas. The charts below show the market trend in Vancouver Heights, Capitol Hill and Willingdon Heights. MLS HPI price is used. Comparing detached properties i

Townhouses and Condominiums in the Area of Simon Fraser University, Burnaby, BC

Image
  Simon Fraser University (SFU) is a public research university in British Columbia, Canada. The main campus is located on Burnaby Mountain, which is a 12 minute drive from downtown Vancouver. It is consistently ranked as Canada’s top comprehensive university. In MacLean’s 2022 rankings, the university placed first in their comprehensive university category. There are more than 30,000 undergraduate and postgraduate students with more than 1,000 academic staff. UniverCity is an urban community on the top of Burnaby Mountain, next to Simon Fraser University. The development of the community began in early 2000. Condominiums and townhouses have been built since then. Now the main commercial area is on University High Street with restaurants, stores and Nester’s Market. University Highlands Elementary School along with child-care facilities accommodate families in the area. The residents in UniverCity have access to the SFU facilities including the art gallery, aquatic center, library, hea

Bungalow Style Properties in Brentwood Park, Burnaby, BC

Image
  Brentwood Park is a very interesting area. New modern high rise buildings are on the south side, and single family houses are located in the middle and north side. A lot of them are bungalow style built in the 1950’s.  They are well maintained, and the size of each lot is large with nice spaces between houses. The whole area is quiet and neat.  It is a very convenient area. Hastings Street is on the north side which is commercial area. Brentwood center is located on the south side. The SkyTrain and freeway are near by. Also, Holy Cross Elementary School is in this area, and ranked #1 in the Province.  Burnaby Hospital is only a few minutes driving distance. The table above lists detached property MLS HPI price in each sub-area of Burnaby since 2015. The price in Brentwood Park is in the middle level in All Burnaby sub-areas.  Also, some pictures in a short video would give some visual ideas with the area. You may like it.  If you would like to know more detail market in Burnaby, plea

High Rise Condominiums in Brentwood Park, Burnaby, BC

Image
Brentwood Park is located in Burnaby North. Brentwood Center is on the south side of Brentwood Park. It was recently completed in 2021 with a lot of shopping, restaurants, commercial services, and other amenities.  Also, it is only a 10 min. drive to downtown Vancouver. The SkyTrain is right in front the center. The freeway is steps away too. All of them make a very convenient living environment. There are quite lot of high rise residential buildings, many of which have been recently built around the center, and even more are in progress. As a result, the condo market prices in this area are higher than other parts of Burnaby. The chart below is a comparison of the market value of condominiums in the Burnaby sub-areas since 2015. The data is by  MLS HPI price . Brentwood Park has seen the highest price in the past 5 years. What do you think the area? Would you like to live in a very modern high rise building with lot facilities indoor, beautiful views out and very convenient neighbou

January Real Estate Market Report for Burnaby, BC

Image
The Real Estate Board of Great Vancouver just released it's market report for January. Inventory has decreased significantly throughout Metro Vancouver as compared to the market in January 2021. The percentage decrease in each part of Burnaby is:  Burnaby North:  detached properties 14.8%, townhouses 57.9%, condominiums 51.6%. Burnaby South: detached properties 35.9%,  townhouses 69%, condominiums 52.1%. Burnaby East: detached properties 48%, townhouses 25%, condominiums 70.6%. The table below shows the actual numbers in each area.   MLS HPI price shows an increasing trend compared to the  previous month, and to the same month in the previous year. The price details are shown in the table below.   It’s clear that it's a strong seller's market in each type of properties across all 3 parts of Burnaby.  See the figures below.   Burnaby North (Data from The Real Estate Board of Great Vancouver) Burnaby South  (Data from The Real Estate Board of Great Vancouver) Burnaby East 

Condominium Market in Burnaby, BC

Image
We have discussed the   detached property market  and the  townhouse market  in Burnaby. Now we talk about the condominium market. The prices in the tables below are the MLS HPI Benchmark Price . Like the townhouse market, condominium benchmark prices had a significant price increase in 2016 and 2017. Also, the average price increase over the 7 year period were: Burnaby North 80%, Burnaby South 60% and Burnaby East 77%. The sub-area that saw the greatest price increase was Simon Fraser Hills at 107% ( from $204,000 to $422,200.)  If you would like to have more detail information regarding Burnaby market, please click here or contact me at awang@macrealty.com 

Townhouse Market in Burnaby, BC

Image
  Townhouses are a style of a multi-floor home that shares one to two walls with adjacent properties, but they have their own entrances. Comparing townhouses with detached houses, it does have some advantages. For example, townhouses generally provide recreational facilities, and people don’t have to worry about external home improvement and landscaping. Also, townhouses often sit in dense and convenient locations. Now we take a look townhouse market in Burnaby. The figures below represent the market trend for each sub-area since 2015. Sub-areas are listed by price, in decreasing order.  The MLS HPI Benchmark Price  is used.  Unlike detached properties,  the significant price increase happened about one year later, in 2016 and 2017, and was not consistent across all areas of Burnaby.   The average price increase over the 7 year period for each part was: Burnaby North 87%, Burnaby South 91%, and Burnaby East 62%. The sub-area that saw the greatest price increase was Government Road at

Detached Property Market in Burnaby, BC

Image
Today we look at the detached property market with in the different areas in Burnaby, BC. Burnaby is divided into three parts; Burnaby North, Burnaby South and Burnaby East. Each part has a number of sub-areas. The figures below show the market trend for each sub-area since 2015. Sub-areas are organized by price, in decreasing order.  The MLS HPI Benchmark Price  is used.  When you look at data, a number of things stand out. The first thing is the significant price increase in both 2015 and 2016. The price then stabilizes for a couple of years before rising again in 2020. The other thing to notice is that this trend is consistent across all three parts of Burnaby.  In addition, the average price increase over the 7 year period for each part was: Burnaby North 52%, Burnaby South 54%, and Burnaby East 70%. The sub-area that saw the greatest price increase was Greentree Village at 84% ( from $628,100 in 2015 to $1,156,400 in 2021) If you would like to have more detail information about Bu